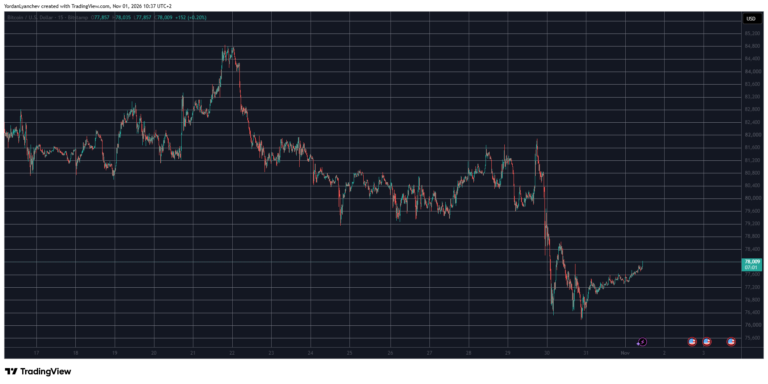
Bitcoin is consolidating around $80,000 after a strong recovery from the $60,000 zone. While the broader structure has changed constructively, BTC now faces a significant resistance zone near $80,000 to $82,000, while momentum indicators suggest the latest advance is losing strength.
Bitcoin price analysis: the daily chart
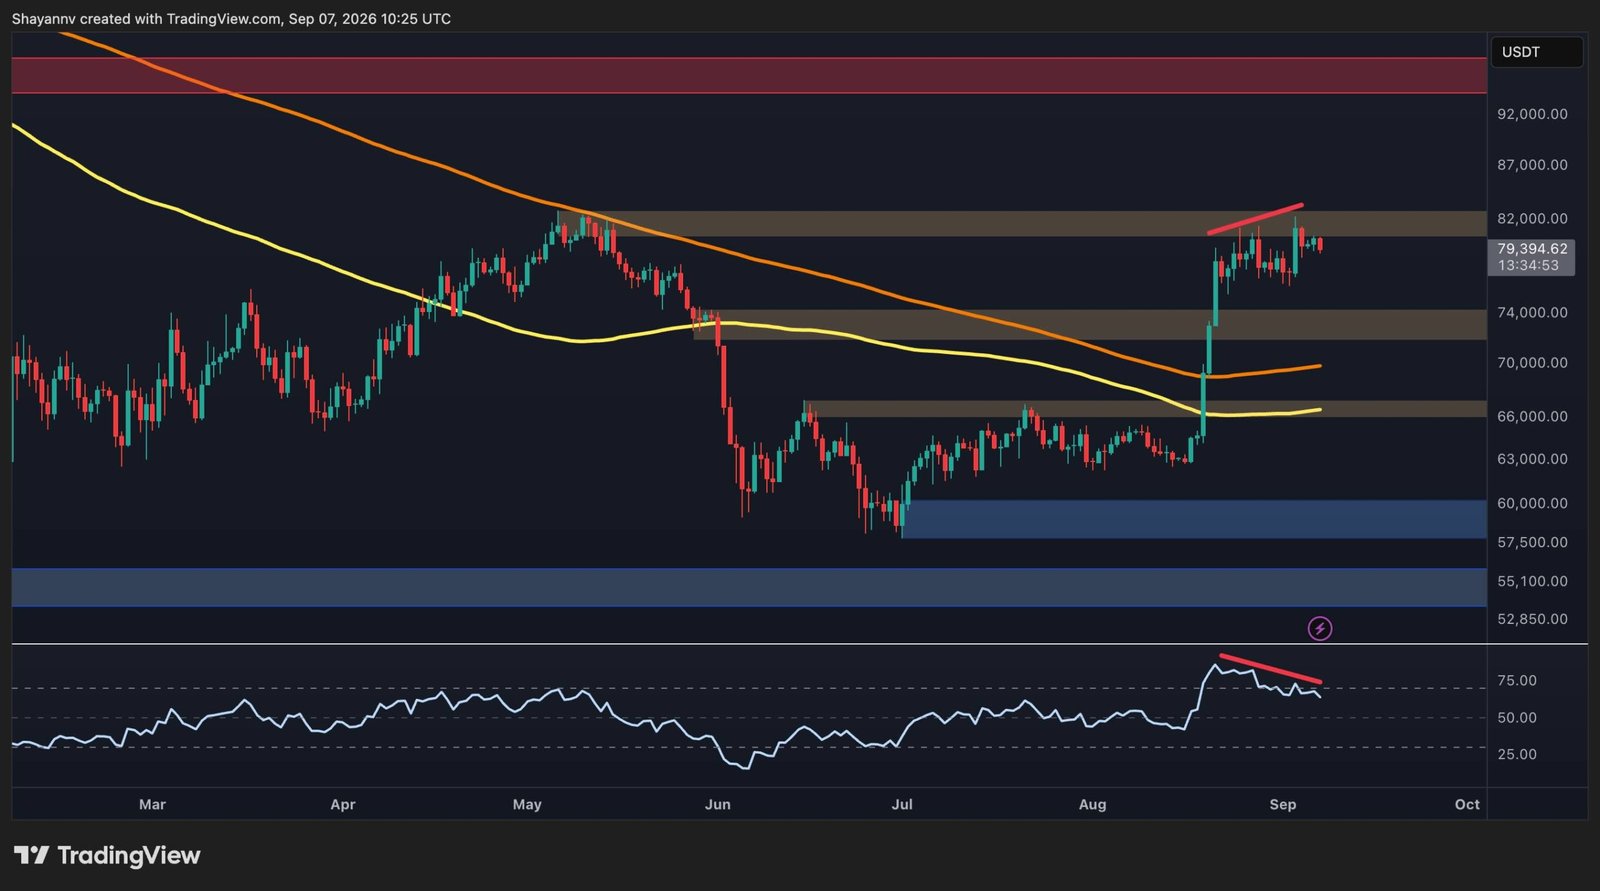
The daily chart shows a clear structural improvement following the strong breakout of the $66,000 consolidation zone. BTC has reclaimed both major moving averages shown on the chart, with the 200-day moving average now around $70,000 and the 100-day moving average near $66,000. As long as the asset remains above these levels, the broader recovery structure remains intact.
The immediate obstacle, however, is the $80,000-$82,000 resistance zone, which has repeatedly capped the recent upside. BTC briefly entered this zone, but failed to establish a lasting breakout and has since moved sideways between $79,000 and $80,000. A decisive daily close above $82,000 would likely reinforce the bullish scenario and expose the next major resistance area around $95,000.
Conversely, rejection from the current area could trigger a deeper retracement towards the $72,000-$74,000 area, which represents the first major daily support area. Below, the $66,000 region becomes particularly important as the last line of defense before the base of BTC’s recent rally.
The RSI has also cooled significantly from its recent overbought reading above 80. More importantly, the indicator is making lower highs as BTC tests or nears previous highs, creating bearish momentum divergence. This does not necessarily indicate an imminent reversal, but it does suggest that bullish momentum is becoming less compelling and that a breakout could require renewed buying pressure following a consolidation or short-term correction.
BTC/USDT 4-hour chart
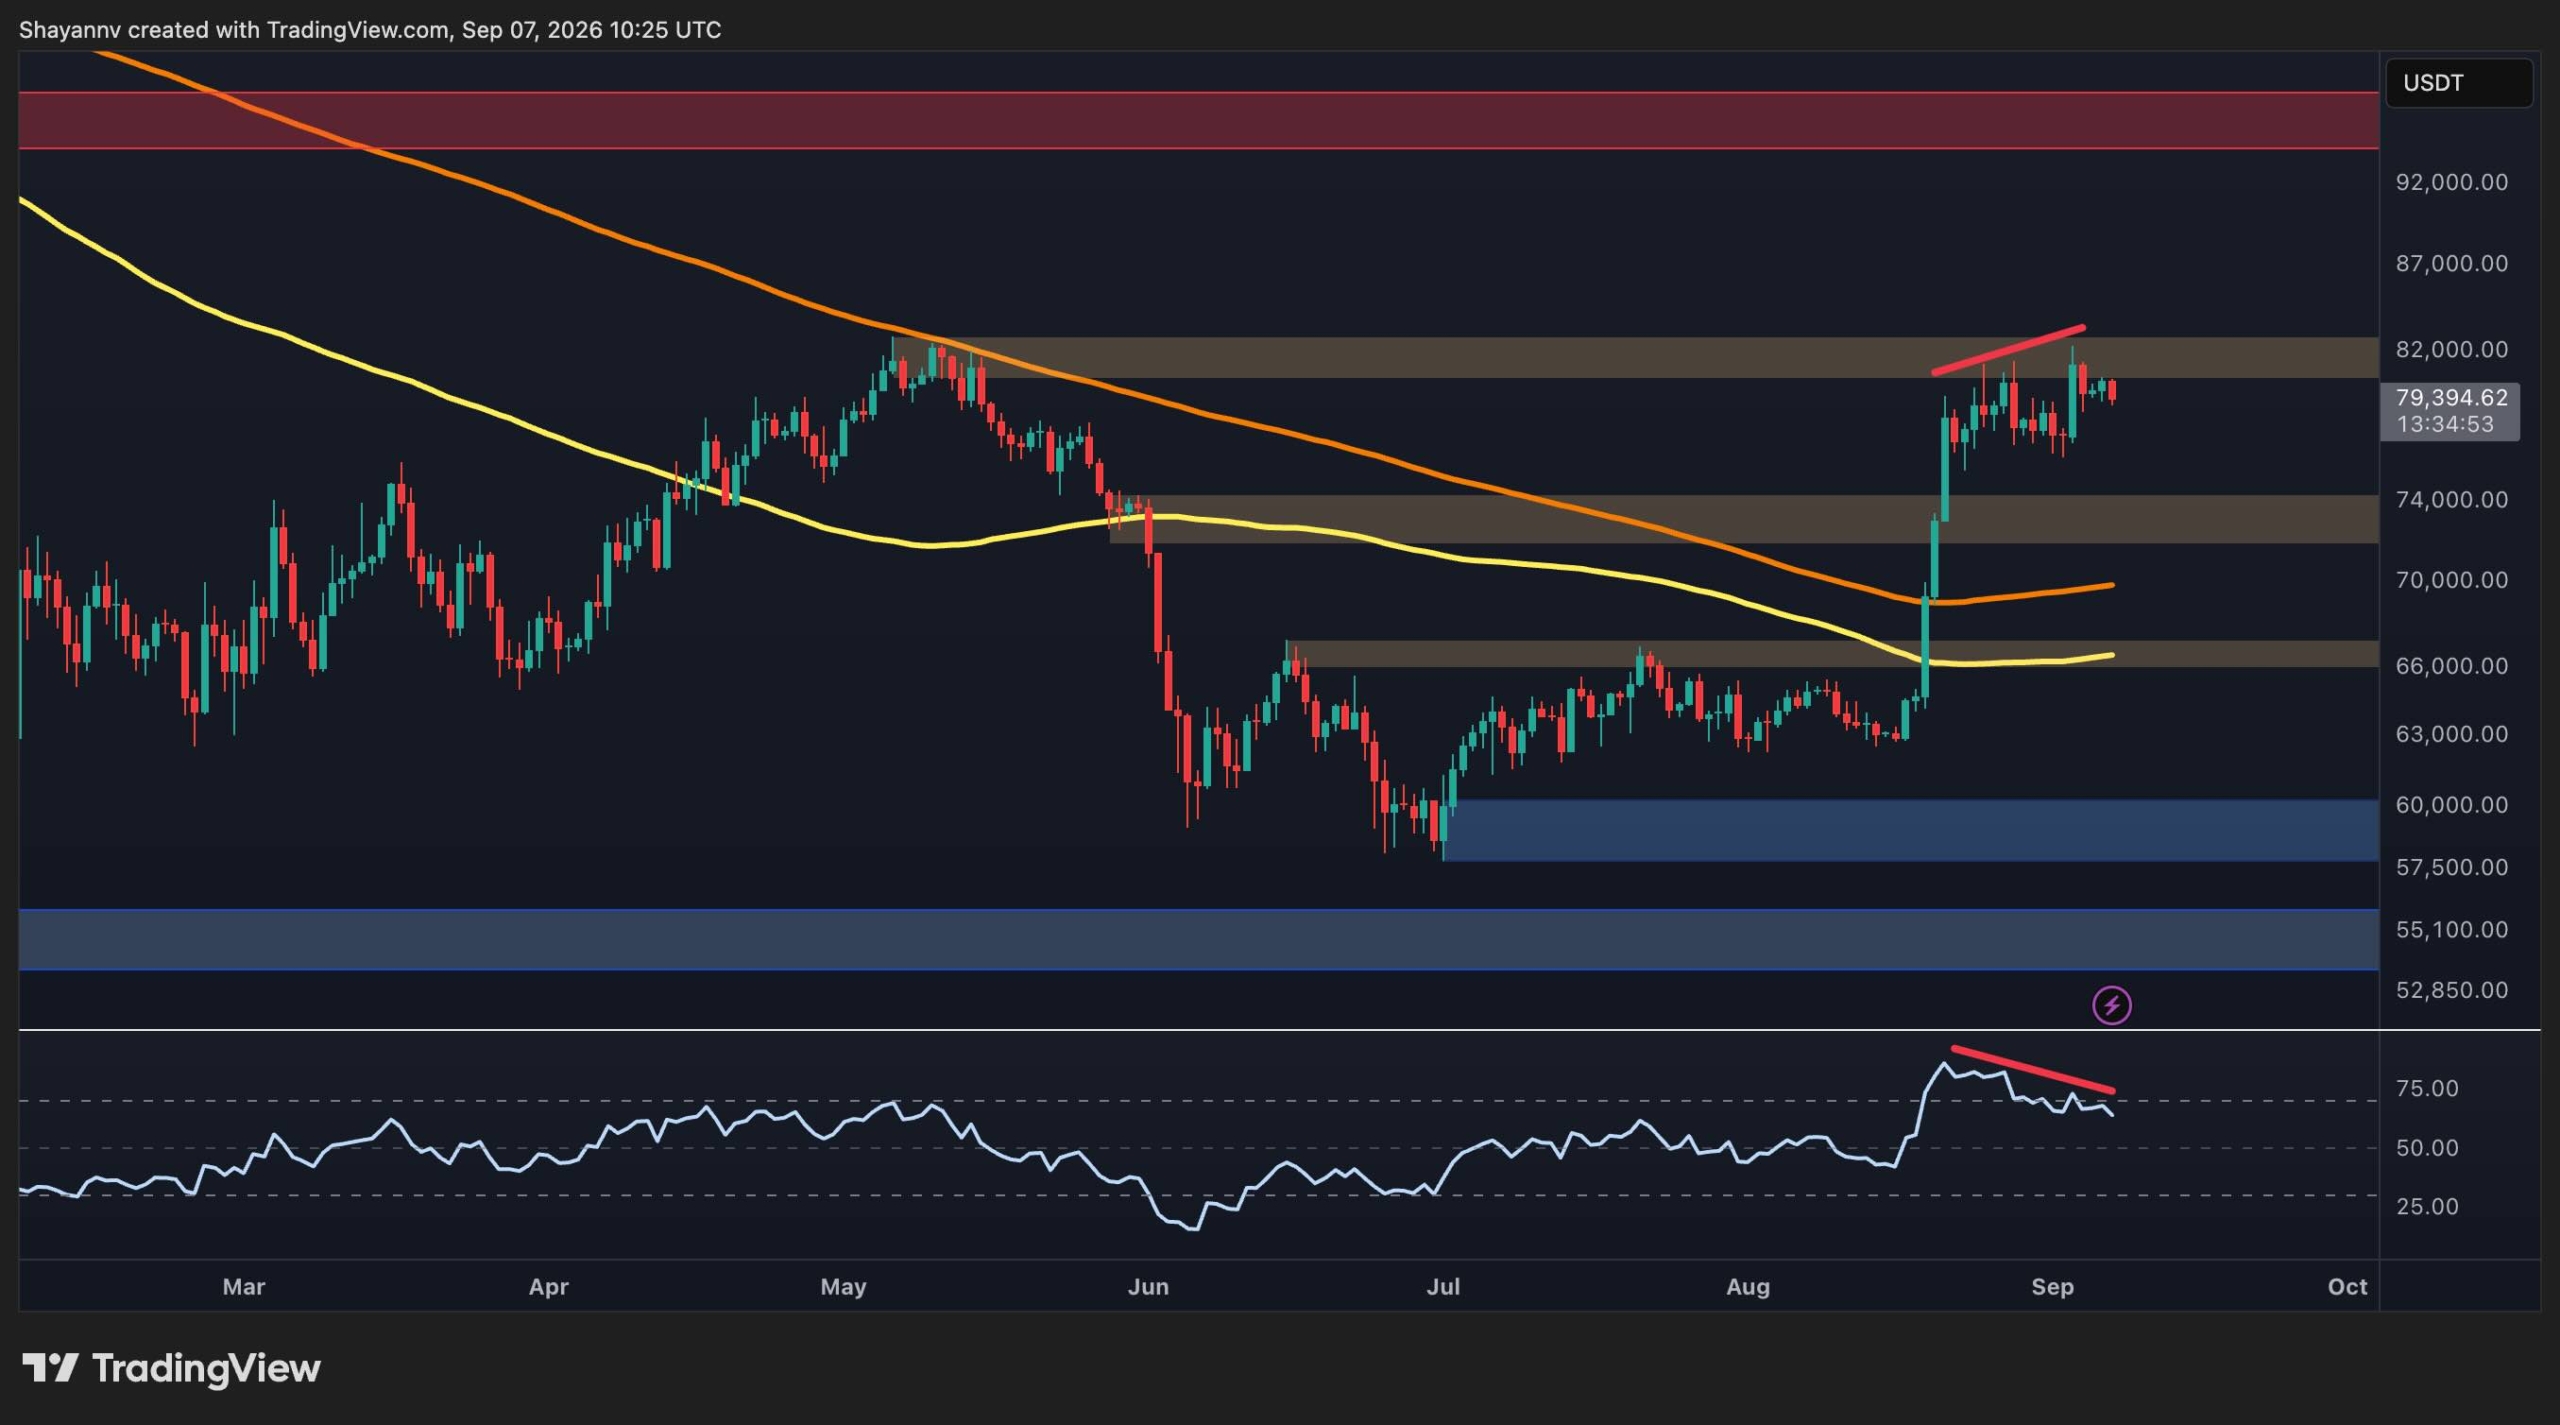
The 4-hour structure presents a more clearly defined ascending channel. After the strong breakout from the $72,000 to $74,000 region, BTC has been oscillating between the ascending boundaries of the channel, with the lower trendline currently located around $77,000 and the upper boundary at $82,000.
The price is currently around $79.4K, leaving BTC roughly in the mid-to-upper part of this range. The $80,000 level therefore constitutes an important threshold in the short term, while the $82,000 level remains the main resistance zone.
A clean break above $82,000, preferably accompanied by a sustained 4-hour close above the channel’s upper boundary, would invalidate the immediate range setup and could open the door to higher levels. On the other hand, a rejection followed by a loss from the trendline below $77,000 would increase the likelihood of a move back towards the $72,000 to $74,000 support zone.
The latest price action also indicates that the strong impulsive upward movement has turned into consolidation. This can be constructive if BTC continues to hold the upper end of the range, but a breakout through the channel’s lower boundary would suggest the market needs a deeper correction before another attempt at the highs.

On-Chain Analysis
The average spot order size chart shows relatively little whale activity around Bitcoin’s current trading range of $77,000 to $80,000. In contrast, there was much more whale activity around the $60,000-$65,000 lows, where larger orders were heavily concentrated. This positioning may have reflected accumulation near the market bottom, as Bitcoin subsequently rebounded strongly from this area to reach $80,000.
The relatively limited whale activity at current levels could suggest that large participants are not aggressively adding exposure around recent highs. This doesn’t necessarily imply a breakdown, but it does indicate that the current rally has not been accompanied by the same degree of whale activity seen near the troughs.
From a broader perspective, the concentration of larger orders around the $60,000-$65,000 zone is notable because it preceded Bitcoin’s substantial rally. If this activity represented accumulation, the ensuing rally could indicate that some of these positions are now profitable. Meanwhile, the lack of significant whale activity around $77,000-$80,000 leaves the market more dependent on the ability of buyers to generate enough momentum to break the $80,000-$82,000 resistance zone.

The article Bitcoin Price Analysis: BTC Bulls Need to Break This Key Level to Regain Momentum appeared first on CryptoPotato.
About the Author